Online Bode plot generator
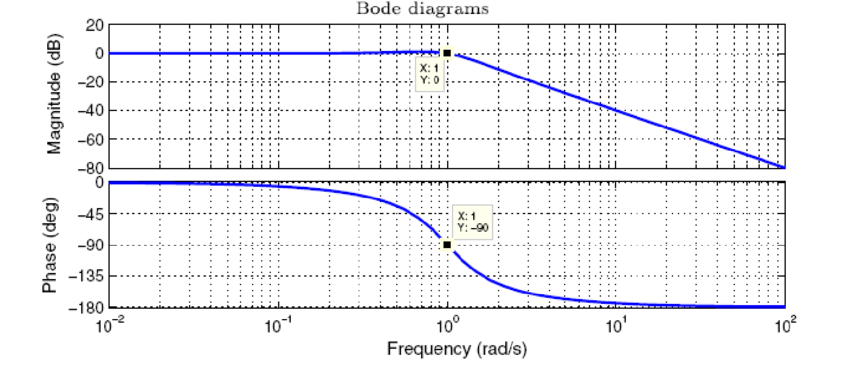
Generating a Bode plot online is a fast way to visualize the frequency response of your filters or control systems without needing expensive software like MATLAB. This tool supports transfer function is following form. Complex conjugate poles can be represented using real and imaginary entries.
$$H(s)=\cfrac{K\left(1+s/z_1\right)\left(1+s/z_2\right)\left(1+s/z_3\right)\dots{}}{s^{n}\left(1+s/p_1\right)\left(1+s/p_2\right)\left(1+s/p_3\right)\dots{}}$$
Input Parameters :
Poles (Hz)
Zeros (Hz)
| Metric | Value |
|---|---|
| Phase Margin (PM) | -- |
| Gain Margin (GM) | -- |
| Phase Crossover Frequency (PCF) | -- |
| Gain Crossover Frequency (GCF) | -- |
| Stability Verdict | -- |
Brief explaination
 The Bode Plot tool is an essential online utility for analyzing the frequency response of analog circuits. It graphically displays the magnitude and phase of a system’s transfer function over a range of frequencies, helping engineers and designers understand how circuits like amplifiers, filters, and control systems behave in the frequency domain. With this tool, you can easily visualize gain margins, phase shifts, and bandwidth, enabling accurate design and troubleshooting of analog signal processing applications.